The Definitive Guide to
Africa's Infrastructure
3,422 tracked projects. $854bn of pipeline. 54 country files, six sectors, and the financing flows behind them — with an AI analyst sitting on top of the whole dataset.
Every country is a file. Click the map.
The choropleth renders whichever indicator you select below — infrastructure stock, electricity access, tracked pipeline, investability. Click any territory to open its country file.
Nine indicators, fifty-four files
Switch the surface metric to re-render the map. Everything on this platform resolves to a country file, a sector file, or a transaction.
Africa carries roughly the same installed generation capacity as Spain and Italy combined for eighteen times the population. Roughly a fifth of it is unavailable at any moment through outage, fuel supply or unpaid maintenance.
Access gains are running just ahead of population growth. The unconnected population is increasingly rural, increasingly concentrated in a dozen countries, and increasingly a distribution problem rather than a generation one.
Counted across AUDA-NEPAD, the AfDB projects portal, World Bank PPI and lender disclosure. Announcement is not commitment: only a minority reach financial close.
Continental GDP per capita sits near $2,000. Infrastructure affordability, not appetite, sets the ceiling on tariff-funded models across most of the map.
Who actually pays for it
Commitments by funder bloc, USD bn. African governments and African DFIs remain the largest single source — a fact almost entirely absent from the popular framing.
Six systems, one balance sheet
Power & Energy
Generation, transmission, access and the transition trade. Africa holds roughly 60% of the world's best solar resource and attracts around 3% of global energy investment. The binding constraint has moved decisively from generation to transmission, distribution and offtaker creditworthiness. Utility balance sheets — not project economics — determine whether a pipeline converts.
Transport & Logistics
Ports, rail, roads, aviation and the corridor economy. Corridors, not countries, are the real unit of analysis. Lobito, Northern, Central, Abidjan-Lagos and Maputo determine landed costs for half the continent's tradeable output. Transit-time data published by corridor authorities is excellent and almost never used.
Digital Infrastructure
Subsea cables, fibre, towers and data centres. The fastest-compounding asset class on the continent. 2Africa and Equiano transformed international bandwidth economics; the constraint has shifted inland to metro fibre, tower power and IX-adjacent compute capacity. AI demand is now a material driver of data-centre planning.
Water & Sanitation
Supply, treatment, irrigation and transboundary basins. Chronically underfinanced relative to burden of disease and economic loss. Utility creditworthiness is weaker than in power, tariffs are more politically constrained, and there is no equivalent of the IPP model at scale — although desalination in North Africa is the closest thing.
Minerals & Resource Corridors
Critical minerals, beneficiation and the infrastructure they demand. Copper, cobalt, lithium, bauxite, iron ore and rare earths are pulling rail, port and power capacity behind them. The policy fight is whether resource corridors carry general freight and power local industry, or function as single-purpose export conveyors.
Urban & Social Infrastructure
Housing, mass transit, health and education assets. Africa will add roughly 900 million urban residents by 2050. Municipal balance sheets cannot carry that build. Sub-sovereign finance, land-value capture and municipal bond markets are the unglamorous instruments that decide whether cities function.
The largest things being built
| Project | Country | Sector | Value | Status | Target |
|---|---|---|---|---|---|
| Egypt New Administrative Capital | EGY | New city | $58bn | Construction | 2030 |
| Tanzania LNG | TZA | LNG | $42bn | Feasibility | 2033 |
| Project Aman | MRT | Hydrogen | $34bn | Concept | 2035 |
| Morocco-UK Power Link | MAR | HVDC export | $24bn | Feasibility | 2032 |
| Eskom Transmission Development Plan | ZAF | Transmission | $21bn | Structuring | 2032 |
| Simandou Iron Ore & Trans-Guinean Railway | GIN | Rail + mine + port | $20bn | Construction | 2026 |
Argument, not press release
 Analysis
The constraint was never capital. It is intermediation.
There is more institutional money looking for African infrastructure exposure than there are bankable transactions to absorb it. The gap is structural, and it sits in project preparation.
 Analysis
The transmission decade
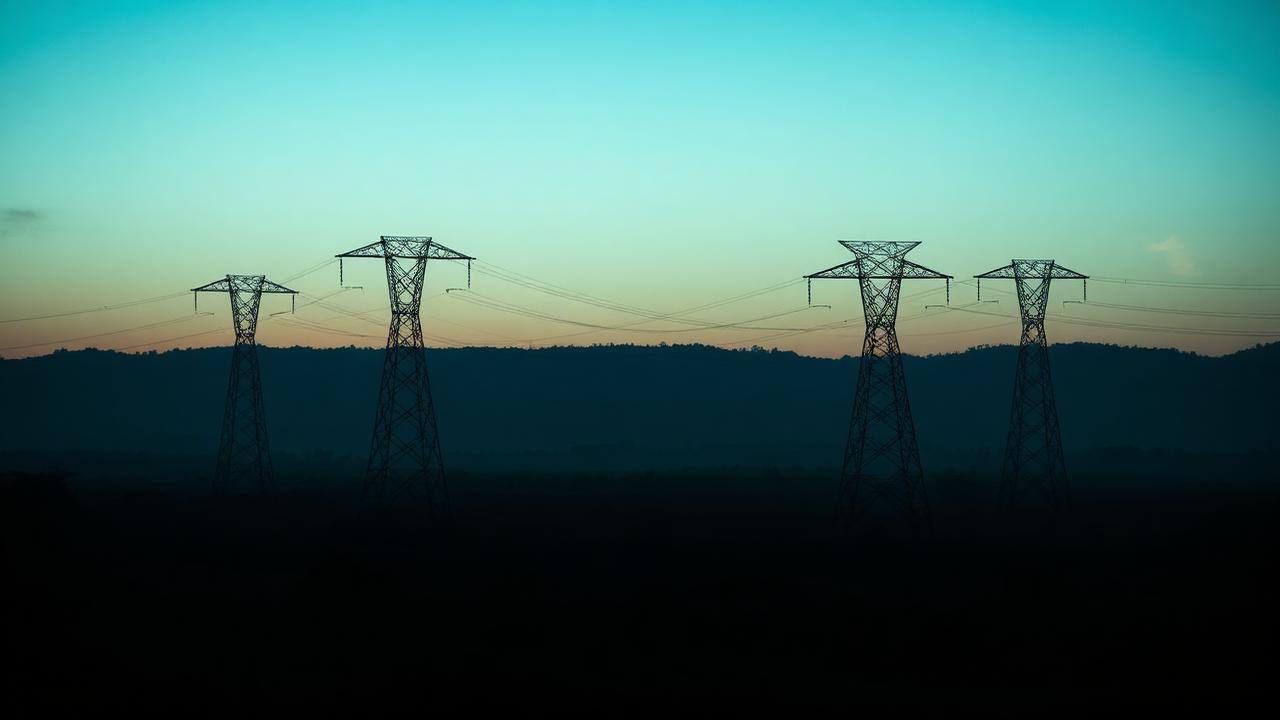
Twenty years of generation-led financing has produced a continent with power it cannot move. Wires, not megawatts, are the 2030 story.
 Op-ed
Op-edLobito is a test of whether corridors can carry more than copper
The West's flagship counter-offer to Chinese resource diplomacy will be judged on whether general freight and local power ever ride the line.
Ask the dataset a question and get a chart back.
The analyst is grounded in every figure on this platform — 54 country files, six sector files, the full tracked pipeline and a decade of financing flows. It returns a structured finding, a generated visualisation and an explicit statement of what the underlying data cannot support.
Open AI Studio